
Map Image
データセットの概要より
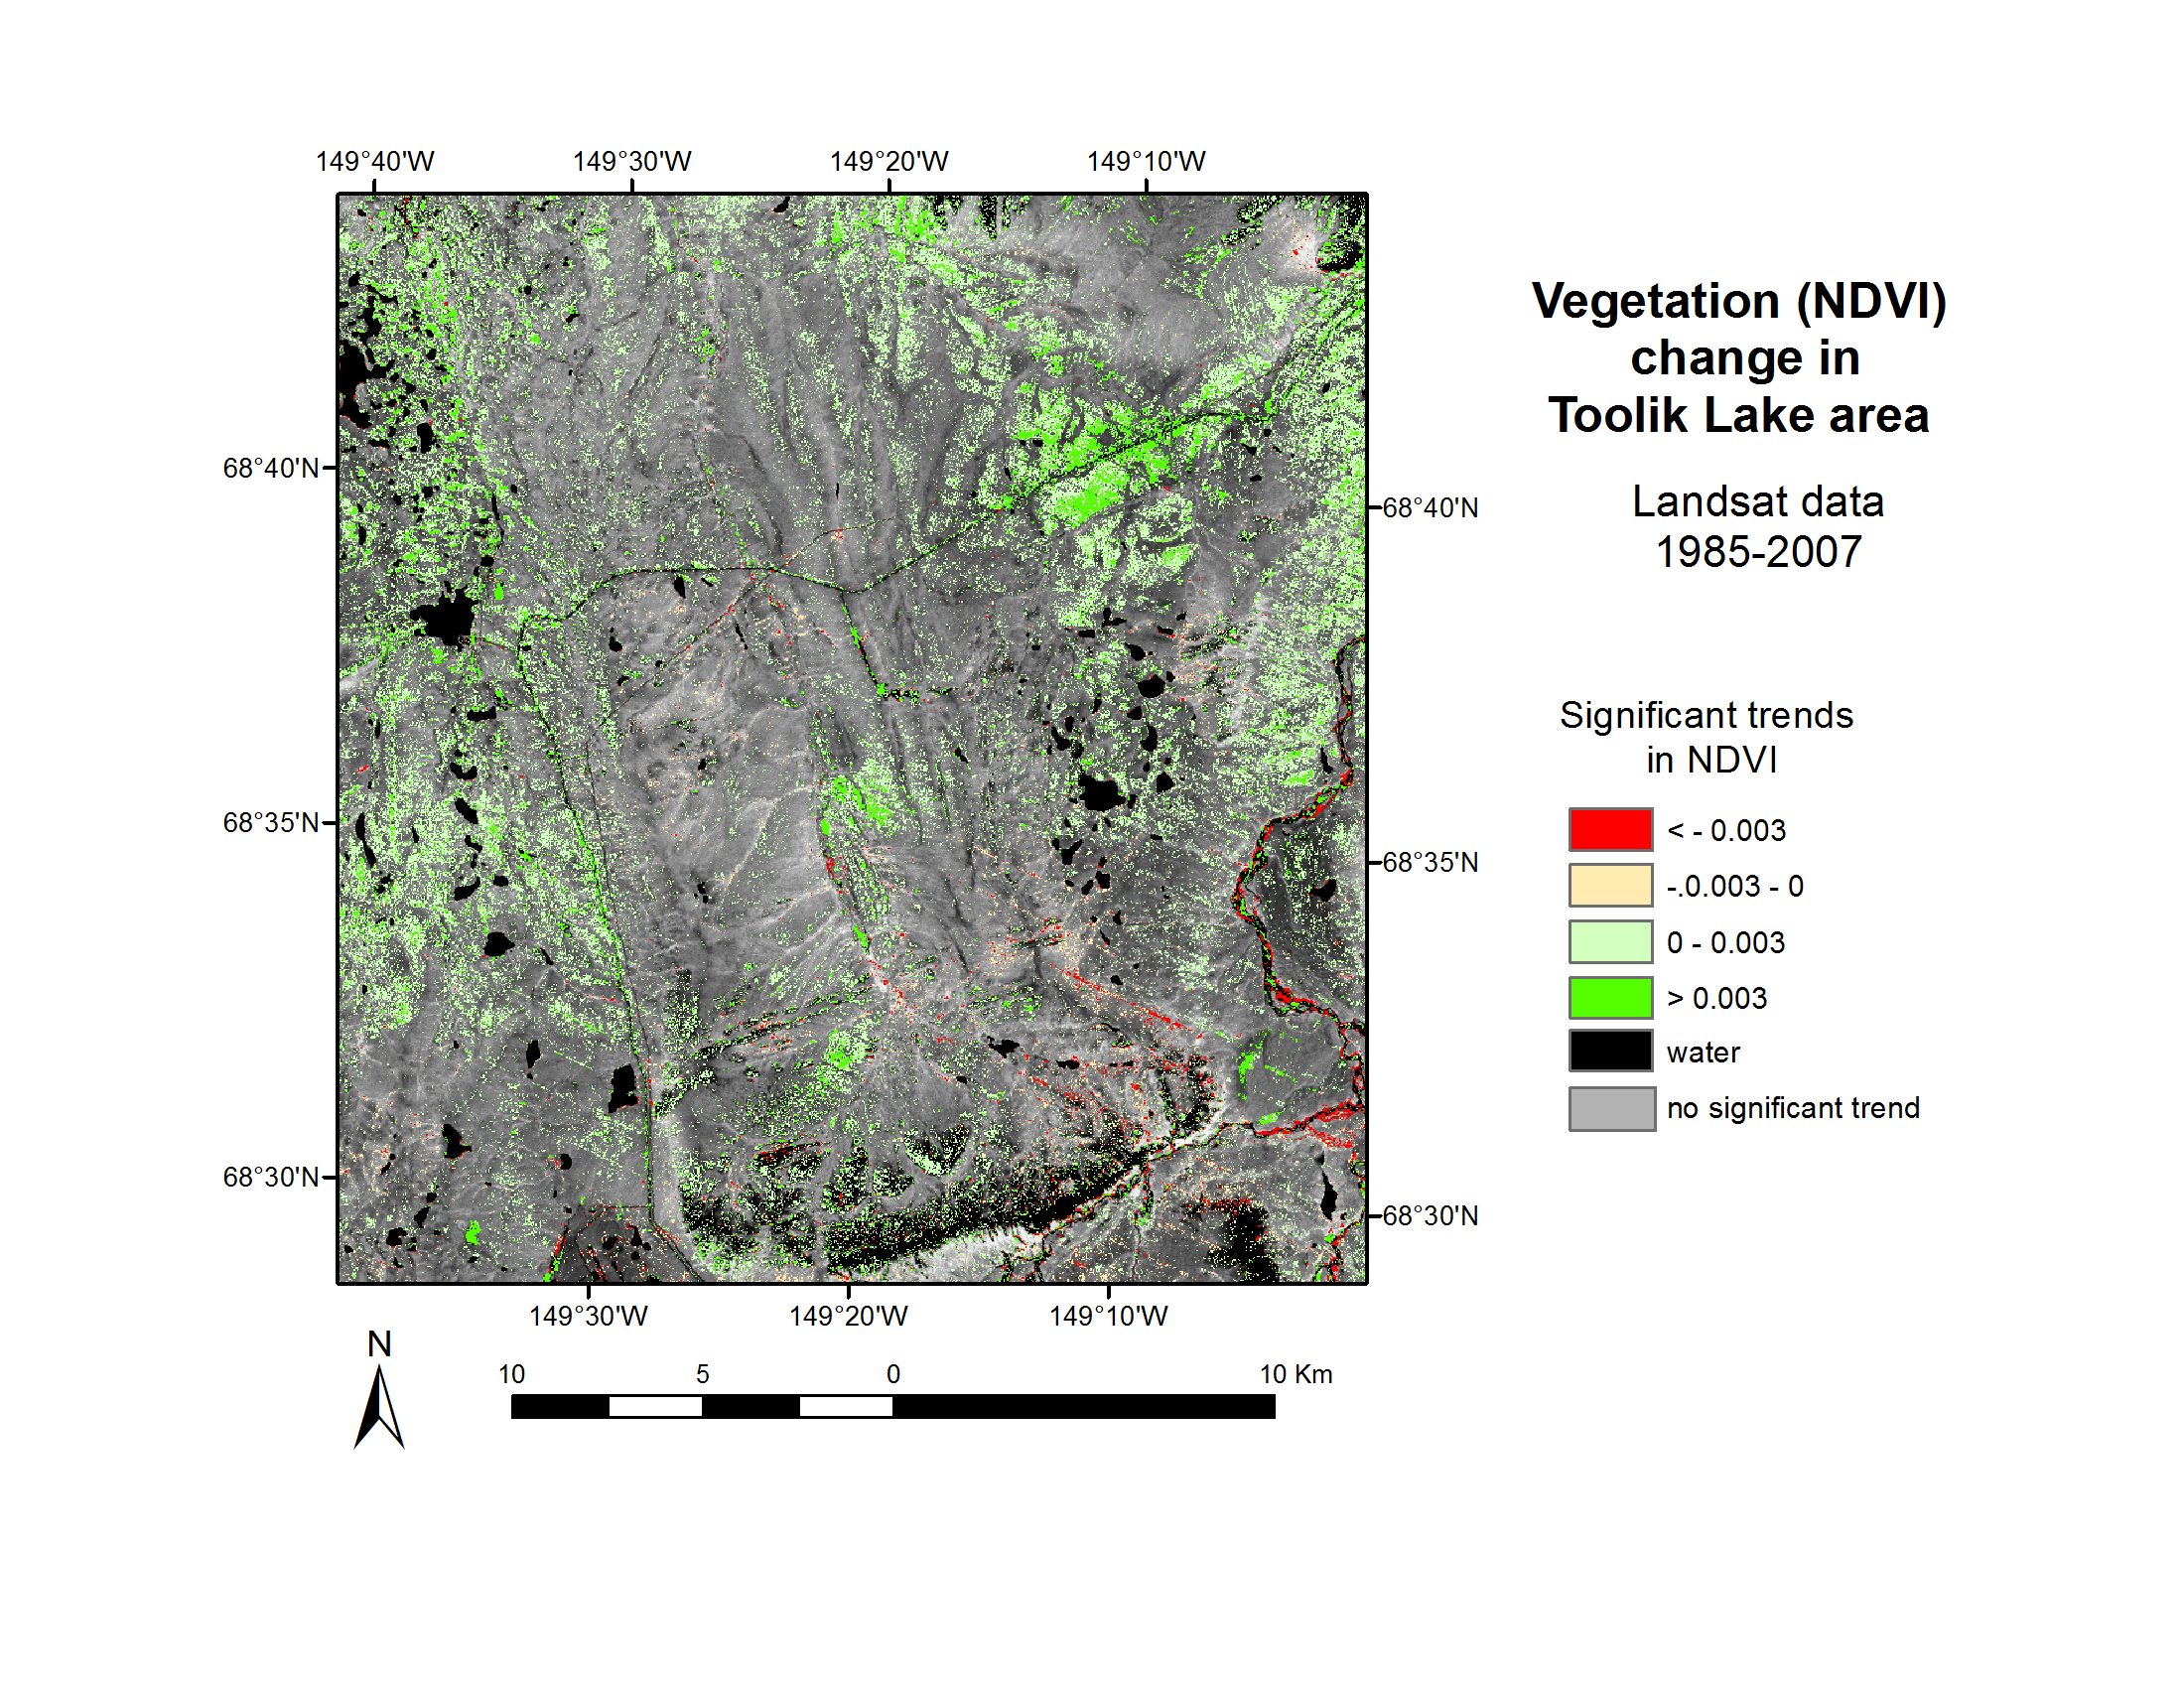
Landsat TM and ETM data were used to calculate NDVI for the study area (823 km^2). This image shows the results of a slope of linear regression of NDVI for 1985, 1989, 1995, 1999, 2004,...
Source: Upper Kuparuk River Region NDVI trend 1985-2007 (Raynolds et al 2010)
追加情報
| フィールド | 値 |
|---|---|
| 最終更新日 | 2019 / 12月 / 17, |
| メタデータ最終更新日時 | 2019 / 12月 / 17, |
| 作成日 | 2019 / 12月 / 17, |
| データ形式 | image/png |
| ライセンス | ライセンスが提示されていません |
| created | 6 年以上前 |
| format | PNG |
| has views | True |
| id | 86b63508-fb1c-4805-8198-3f8540fc73fe |
| last modified | 6 年以上前 |
| mimetype | image/png |
| on same domain | True |
| package id | 47ebb8e6-f191-4d13-b47f-4e3bff645b8e |
| position | 1 |
| revision id | 2af864cb-8caf-4657-ac4b-66c34bdf412d |
| size | 1.4 MiB |
| state | active |
| url type | upload |